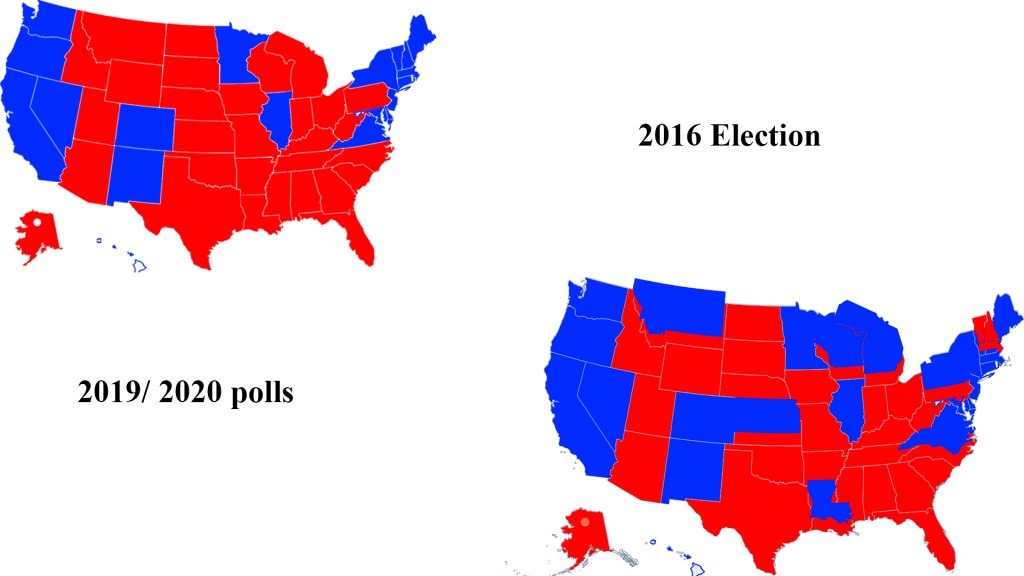
Social Graphic Posted byAdam Kizun26th Mar 2020Posted inUncategorized This social graphic shows the difference between the 50 states’ political leanings since the 2016 election. Share this: Click to share on X (Opens in new window) X Click to share on Facebook (Opens in new window) Facebook Like Loading... Related